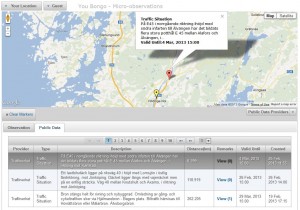
After intensive work we now publish a new module for YouBongo to visualize the open data. This is a continuation of our commitment to making open data useful for the users. We focus on creating opportunities for collaboration and comment on open data. The first providers of open data is Swedish Transport Administration service for traffic information. The module for visualization is a beta version and we expect a period of fine tuning before we got all the details in place.

The module for the visualization of open data, shows the user’s current location and how far it is to different traffic situations and incidents. This makes it easy for the user to focus on what is near or on the literary he or she intendant to make.
We will continue to look for interesting provider of data that we can adapt and visualized in an attractive way for the user. We want to thank the Swedish Transport Administration for answer our questions during the testing phase.
Partially translated by Google Translate
