User demand driven and machine-readable open data

water-drop

Open data is undergoing a paradigm change where the focus is shifting to user demand driven publication of data in machine-readable formats, with open standards and licenses that is appropriate for its application area. This is often refereed to as “liquid information” or “liquid data” which can be read about in this report from McKinsey’s 2013. The report address the potential value that can be achieved if standards, formats and metadata are functional for its intended use. Open data 2.0 is another emerging term which refers to data that is being made available based on demand and provides means for participation and collaboration, where users can report suggestions for improvement and provide feedback on flawed data. Continue reading “User demand driven and machine-readable open data”

Postman OAuth 2.0 guide for Västtrafik API

We are currently working on evaluating the API for public transportation data and journey planing in the Gothenburg and west-coast area of Sweden. We used the API client Postman to access the transportation data. The current guide for the API portal is only in Swedish and we stumbled upon some problem setting up the OAuth 2.0 authentication. Which is why we thought of sharing how to configure the authentication, so you can start exploring the data. Continue reading “Postman OAuth 2.0 guide for Västtrafik API”

Background to review open API:s

garbage

In order to create better value and promote reuse of open data there is a need for a systematic approach to review different open data and API services provided by data owners and suppliers. Open data has the potential to generate viable services, efficiency trough reuse, innovation and  community involvement. Although several studies suggests that this potential is not being used to full extent. Which means that economic and social values are being lost, and the cost of maintaining these open data sources could be put to better use elsewhere.

podium

The review protocol is divided into a number of categories linked to areas expressed in W3C best practice guide for open data. Within each category, there are a number of evaluation tasks with a maximum score that reflects how well the owner or provider of open data reflects good practice. Each category has a total score that can be awarded, which together represent a total sum that a owner or supplier may receive. The purpose of the tests is to provide an indication of the usability and accessibility of the open data source from an external user perspective.

Following categories are included in the review;

  • Licensing and impartial usage
  • Support and documentation
  • Accessibility and API structure
  • Dataformat and quality
  • Reliability
  • Usability

Development phases for building services on open data

Previous article described various obstacles commonly related to service development based on open data. Obstacle is the first dimension of a model intended to gather and categories problems related to third-party development based on open data. The second dimension of the model concerns different phases that third-party developers goes through when creating services. Continue reading “Development phases for building services on open data”

Common obstacles related to service development based on open data

Studies carried out by Viktoria Swedish ICT, on behalf of the Swedish Transport Administration (Trafikverket) shows that service development based on open data are consistent with various obstacles. To better understand problems related to the use of open data when developing services, a project was initiated 2014 to explore how owners and providers of open data could create better value for service developers. The premise for the project was to view open data as a service and study what created  value for third-party developers. The reason for the focuses on third-party developer is that they portray a heterogeneous user group with a wide array of incentives for using open data. Continue reading “Common obstacles related to service development based on open data”

Open data and value generating mechanism

For third-party developer to be effective in their work creating product and services that uses open data. The providing organisation of data must provide value generating mechanism that facilitate and support their effort. One recent study done by Viktoria Swedish ICT in collaboration with the Swedish Transport Administration (STA), investigated which mechanism that third-party developers values when drafting services that uses open data.

The study conducted in-depth interviews with enterprises and individuals that uses traffic information from STA and has developed a embryo for a model that points-out process and principals that are important to support third-party developer working with open data. The value generating mechanism that emerged during the interviews with third-party developers related with supporting functions that are common in a service-provider and consumer relationship. These are documentation, customer support and relation etcetera. Other supporting mechanism are more specific and concerns data format and level of data resolution that third-party developer need to handle when working with API:s and web services. One of the findings in the study was that although open data is per definition free service doesn’t change the fact that customers need support from the service-provider.

Future post will in detail explain each value generating mechanism more in detail. The list below show the mechanism that emerged from the study, notice that list can change since this is ongoing research.

  • Data format
  • Data resolution
  • Refinement of service content
  • Support and documentation
  • Customer care and partnership
  • Openness and transparency

Open data, what economical and social value does it generate?

Clear Byte work on making information sharing smart and at the same time create a visual understanding of content. One valuable source of data that more people should take advantage of is open data. Open data exist in different shapes and forms but are mainly provided by public sector thought open API:s and web services. In Europe there is a EU directive that recommends and guides governmental organisations to make more data available.

Open data is estimated to have great economical and social value. McKinsey Global Institute estimate that the potential value of data in seven domain areas has could be over $3 trillion only in the US. The first day that Obama took office he signed an executive order to make all governmental data open and machine-readable, i.e. open data. That has today lead to the US are amongst the top three countries in the world in providing open data.

We intend to post a number of articles that focusing on how governmental organisations that provides open data can create a greater value for third-party developers. Third-party developers are a groups of heterogeneous actors that spans from hobby programmer, small start-up companies to global enterprises. The reason that we focus on third-party developers is that this groups is the most important one to create the alleged economical and social value. Next post will address value creating mechanism that facilitates uptake and usage of open data services.


YouBongo – Visualizing Open Data

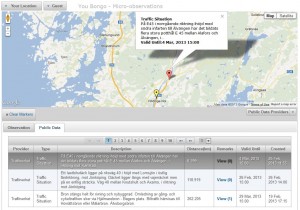
After intensive work we now publish a new module for YouBongo to visualize the open data. This is a continuation of our commitment to making open data useful for the users. We focus on creating opportunities for collaboration and comment on open data. The first providers of open data is Swedish Transport Administration service for traffic information. The module for visualization is a beta version and we expect a period of fine tuning before we got all the details in place.

You Bongo - Traffic Info
You Bongo – Traffic Info

The module for the visualization of open data, shows the user’s current location and how far it is to different traffic situations and incidents. This makes it easy for the user to focus on what is near or on the literary he or she intendant to make.

We will continue to look for interesting provider of data that we can adapt and visualized in an attractive way for the user. We want to thank the Swedish Transport Administration for answer our questions during the testing phase.

Partially translated by Google Translate